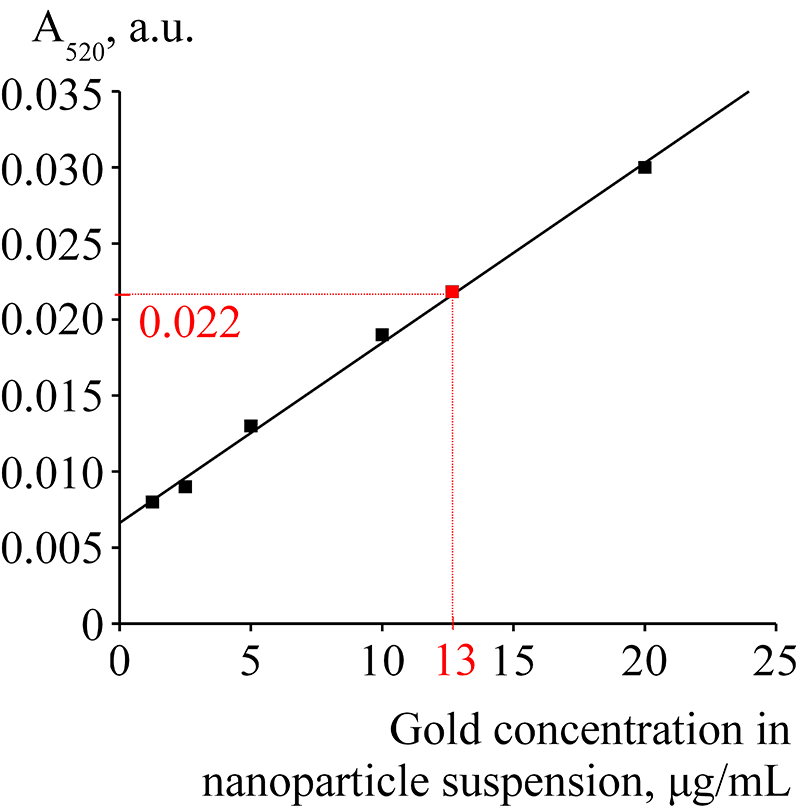
Figure 3. A calibration plot for different gold nanoparticles concentrations (1.25, 2.5, 5, 10, 20 mkg/mL). The red point in the plot is corresponded to suspension of gold nanoparticles conjugated with polyclonal antibodies to B2M.