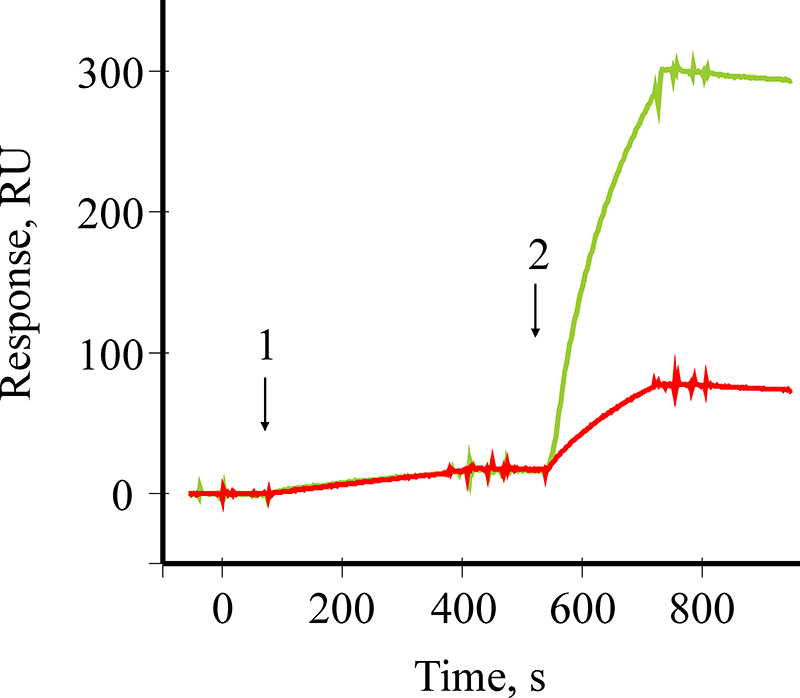
Figure 4. The sensogramms of SPR signals enhanced by injections either Pab (red line) or Pab/GNP conjugates (green line) while detecting B2M as a biomarker. The onset of sample injections of 100 pM B2M and Pab (or Pab/GNP conjugates) are shown by arrows 1 and 2, respectively.