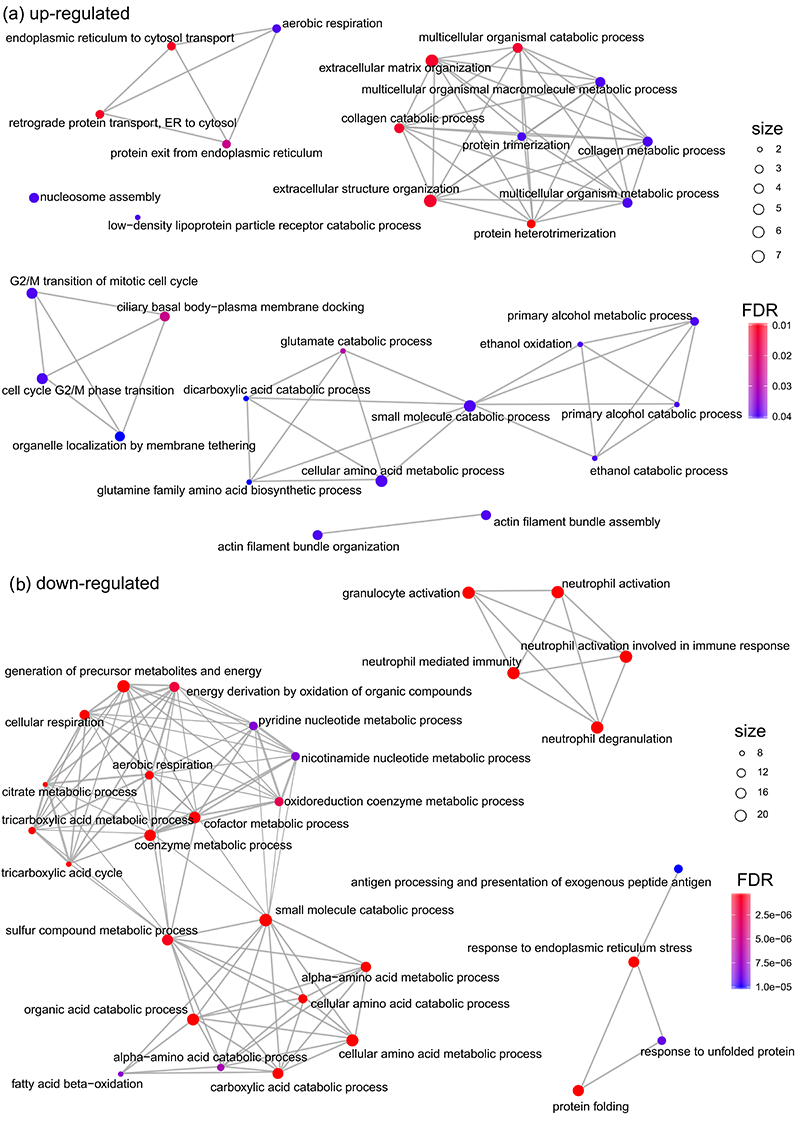
Figure 3. Gene ontology, GO overrepresentation analysis of up-regulated (a) and down-regulated (b) proteins. Each significantly enriched GO term is represented as a graph node and terms with similar gene content are connected with an edge. Size of the node is proportional to genes belonging to the GO term and color encodes for adjusted p-value ,FDR of enrichment significance.