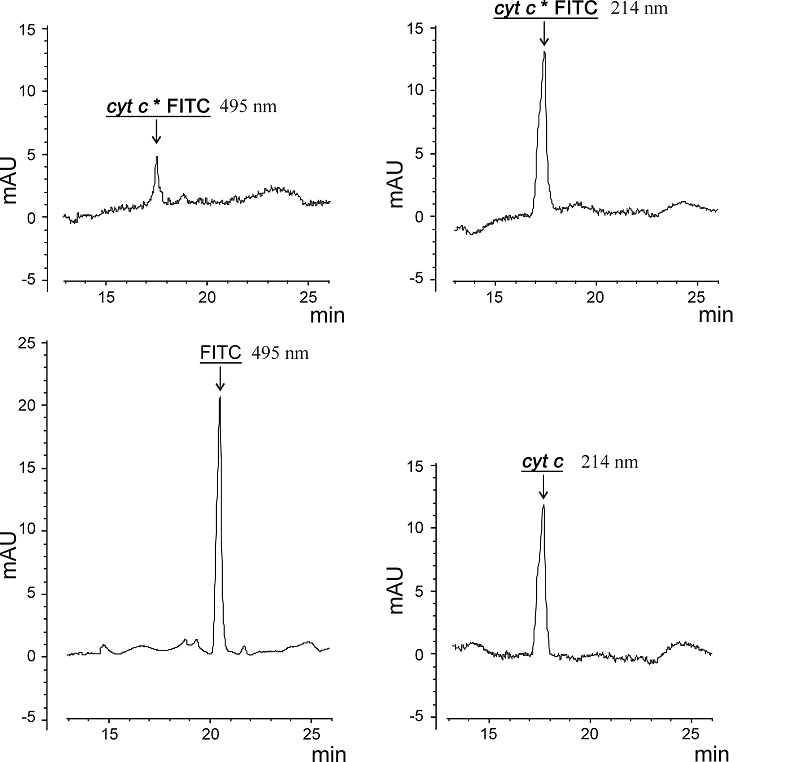
Figure 1. SDS-CGE-UV electrophoregrams of unlabeled and FITC-labeled cytochrome c forms as well as FITC preparation itself. For comparative analysis, identical amounts (150 μg) of unlabeled and FITC-labeled cytochrome c forms were used. A sample containing 20 μg free FITC was used