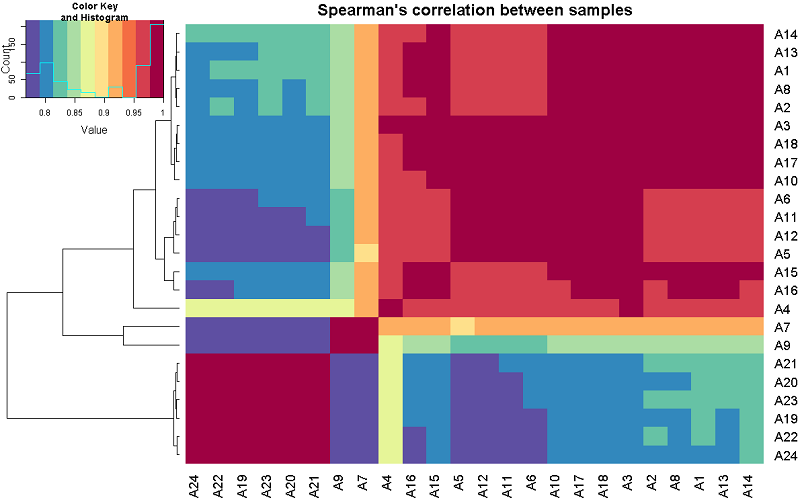
Figure 3. The heat map of the correlation analysis of the studied samples. On the left is the sample cluster analysis. The correlation was calculated for all 24 samples from two biochips after sorting the data by the significance level of the detected fluorescence signal (p≤0.05).