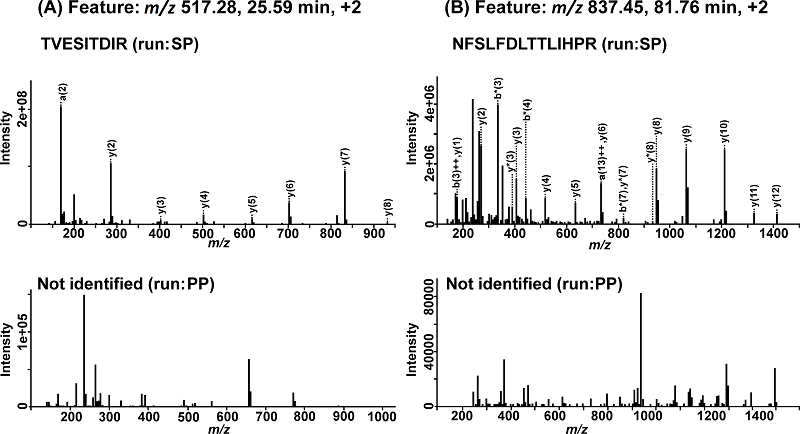
Figure 2. An example of MS2 spectra corresponding to the same MS1 features of samples of mixtures of proteolytic peptides of human blood plasma (PP) co-aligned with samples of the same mixtures with spike-in synthetic peptides (SP). (A) An identified (for SP) MS2 spectrum of peptide TVESITDIR and an unidentified (for PP) MS2 spectrum corresponding to a MS1 feature with m/z 517.28. (B) An identified (for SP) MS2 spectrum of peptide NFSLFDLTTLIHPR and an unidentified (for PP) MS2 spectrum corresponding to a MS1 feature with m/z 837.45.