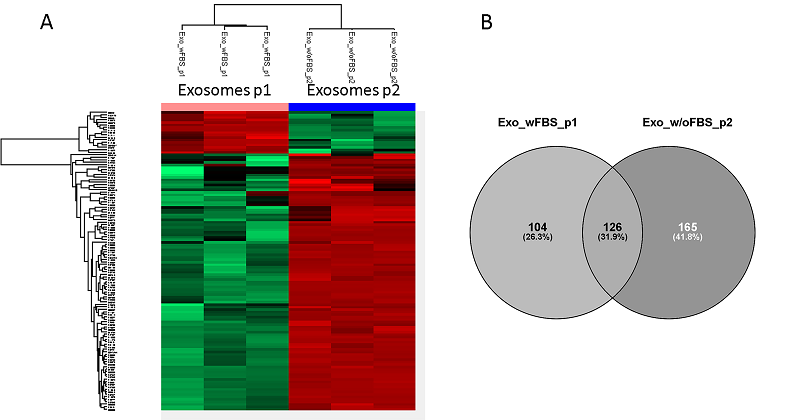
Figure 4. A. Heat map of the labeled-free quantification results for exosome samples isolated according to two protocols: protocol 1 (p1) - exosome isolation according to the UC1-UC2-SUC scheme, hydrolysis in solution; protocol 2 (p2) - exosome isolation according to the UF-UC-SUC scheme, FASP hydrolysis; results are shown for 120 proteins whose content is significantly different (Fold change (FC)> 2, FDR). B. Venn diagram showing intersections of proteins identified by using two protocols.