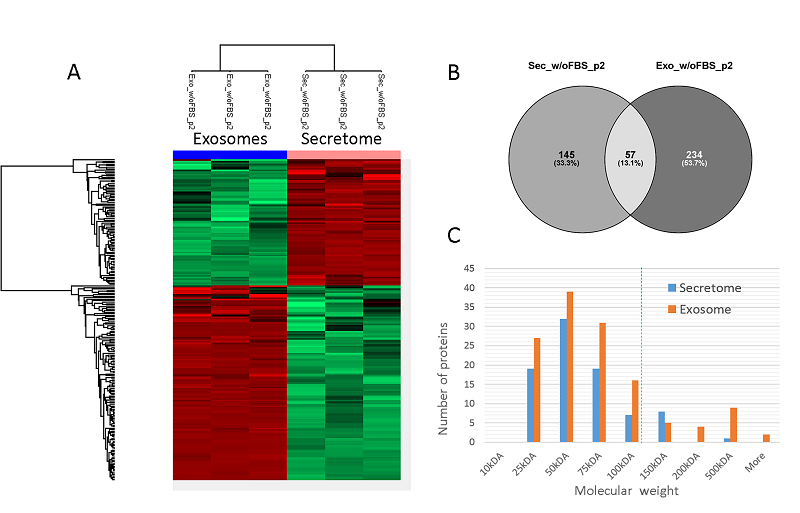
Figure 5. Heat map of the labeled-free quantification results for secretome and exosome samples isolated according to protocol 2 (p2) - exosome isolation according to the UF-UC-SUC scheme, FASP hydrolysis; results are shown for 219 proteins whose content is significantly different (FC> 2, FDR). B. Venn diagram showing intersections of proteins identifications in the secretome and exosomes. C. Molecular weight distribution of proteins characterized by increased content in secretome and proteome samples, respectively. The red line shows the molecular weight cutoff value of 100 kDa at the UF stage.