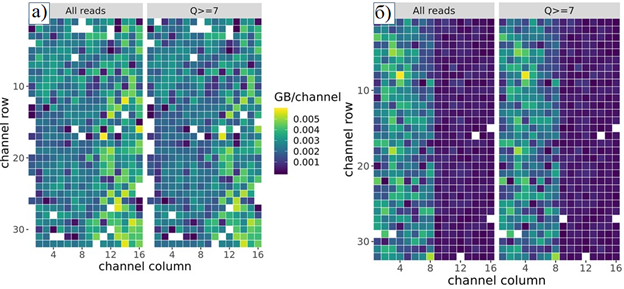
Figure 2. The heat map showing the number of gigabases read in the MinION sequencer nanopore channels: (a) most cells are working and (b) the efficiency of half of the cells has significantly decreased. Each channel is marked with a "square" in the figure, the axes set the coordinates of the cell topology. The color depends on the amount of data read. Squares of white color mean that the cell did not work (for example, due to a technical error in the preparation of the experiment). Dark blue squares indicate that although information was coming from the cell, but the amount of data read in that cell was insignificant. Q>7 is a quality criterion for the sequencing process, reflecting that the number of working pores in the cell must be at least 7 times higher than the number of inactive pores.