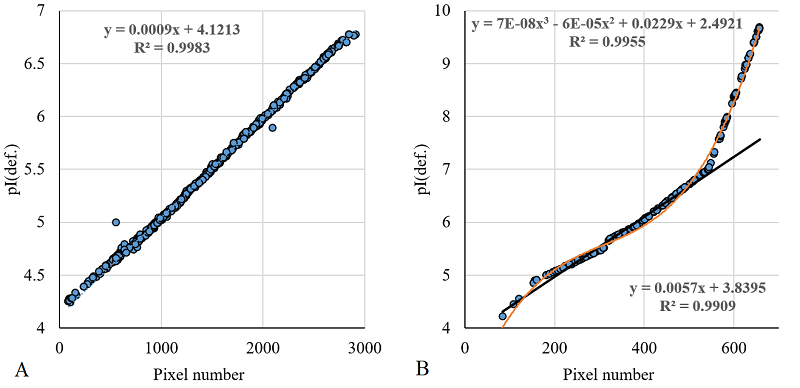
Figure 1. The comparison of assigned pI values and coordinates along the abscissa axis on the 2D electrophoretic map. A. Data from RAT_INS1E_4-7 - there are 2 points with errors. B. Data from RBC_HUMAN - a cubic spline equation describing the entire data set and an equation describing a linear section are shown. If the data are obtained in a single experiment and without failures, there should be no "step" near 310 pixel.