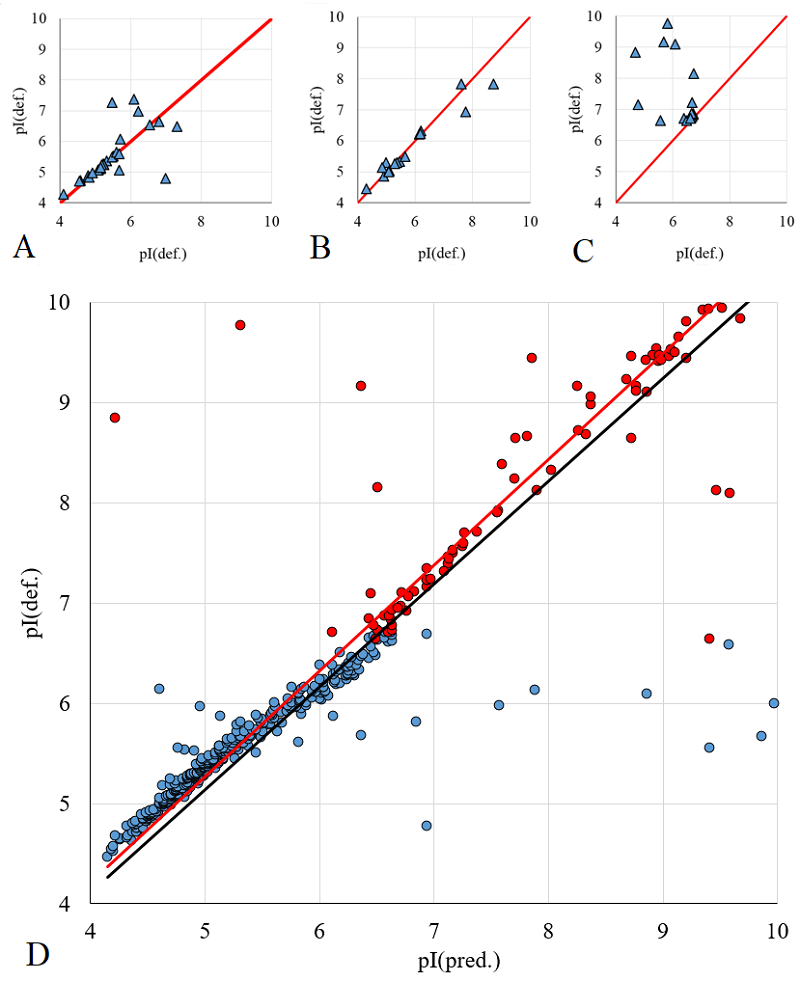
Figure 5. A, B, C - The pairwise comparison of the assigned pI values from different experiments (Homo sapiens, Mus musculus and Staphylococcus aureus). D - Comparison of assigned and predicted pI values for Staphylococcus aureus proteins obtained from different 2D maps (blue - STAPHY4-7, red - STAPHY6-11).