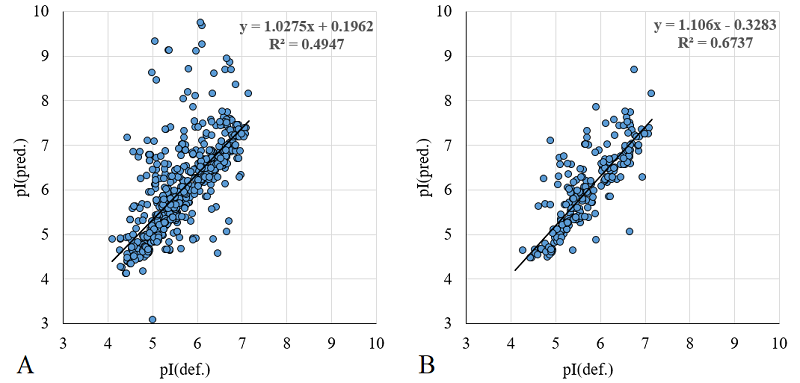
Figure 7. The comparison of assigned and predicted pI values for a set of proteins combining data from Homo sapiens, Mus musculus, and Rattus norvegicus maps. A. The filtration for explicit errors only, selection of linear part depending on pixel coordinates, selection of most basic value in the presence of variants. B. The filtration by Δlg(MW) value <= 0.05 is added.