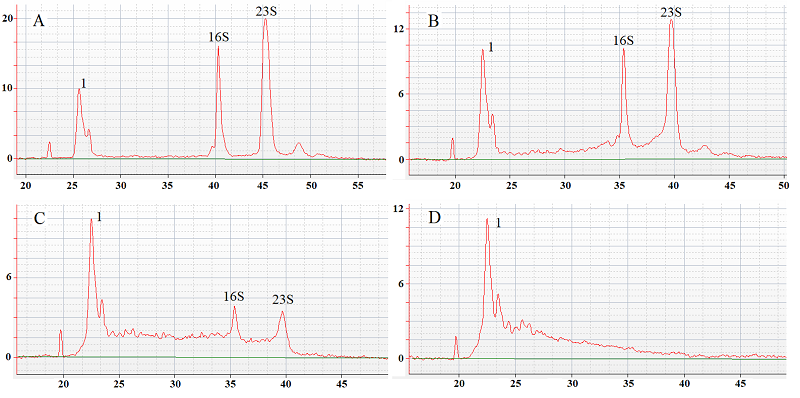
Figure 1. Electrophoregrams of the E. coli total RNA (panel A) prior and after incubation at 37°C in the presence of RNase A at a concentration of 6·10-9 U/µl for 10, 60 and 120 minutes (panel B, C and D, respectively). 1 is the leading marker; 16S and 23S indicate the peaks of 16S and 23S ribosomal RNA, respectively. The abscissa is time (s); the ordinate is fluorescence (arbitrary units).