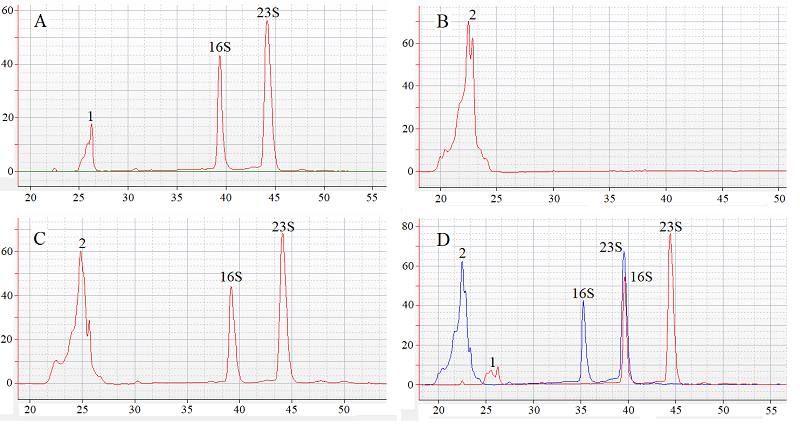
Figure 2. Electrophoretic analysis of samples containing components of the reaction mixture in various combinations. Panel A - E. coli total RNA; panel B – guide RNA; panel C – a mixture of total RNA and guide RNA; panel D – a mixture of total RNA, guide RNA and Cas13a-nuclease (red electrophoregram – only Cas13a-nuclease; blue – Cas13a-nuclease and guide RNA). The guide RNA and Cas13a concentrations in the samples are 450 and 45 nM, respectively. Samples were incubated for 1 hour at 37°C before analysis. 1 – leading marker; 2 – guide RNA; 16S and 23S indicate the peaks of 16S and 23S ribosomal RNA, respectively. The abscissa is time (s); the ordinate is fluorescence (arbitrary units).