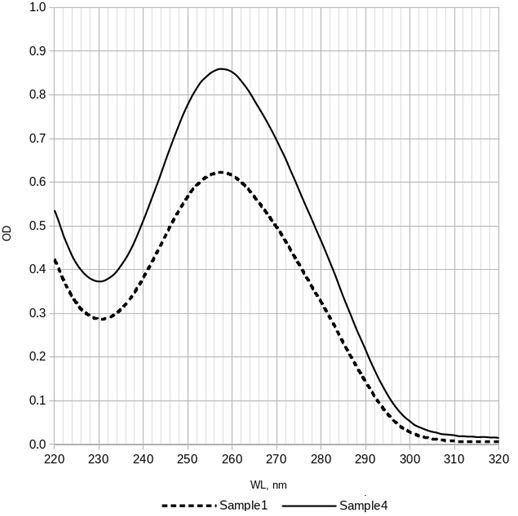
Figure 2. UV absorption spectrum of pDNA samples. The optical density values are plotted along the vertical axis, and the wavelength in nm is plotted along the horizontal axis. Measurements were carried out for pDNA samples diluted 20 times with water in quartz cuvettes with an optical path length of 1 cm on a UV-1900 spectrophotometer.