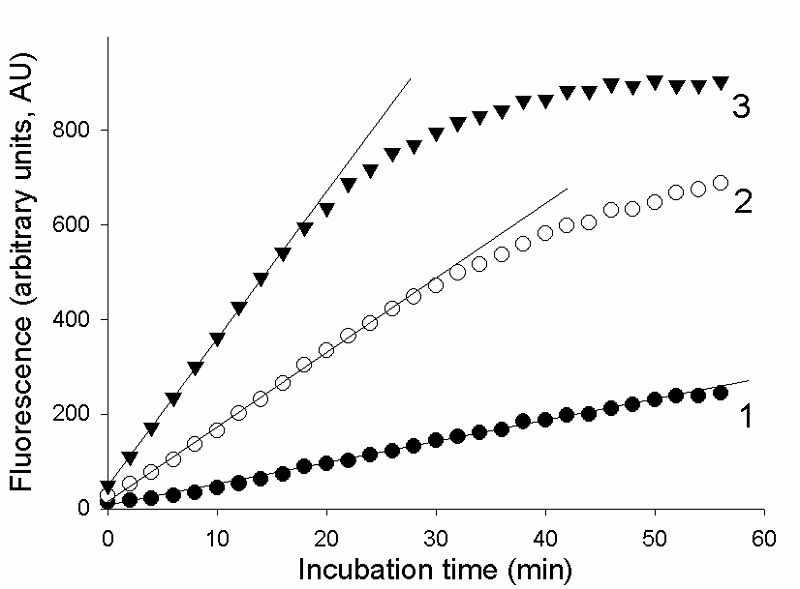
Figure 1. The typical kinetic curves for the cleavage of FQ-reporters by RNase A: the dependences of fluorescence on incubation time for different amounts of RNase A. RNase A activity (U) in a 50 µL sample: 1 – 3·10-8, 2 – 10·10-8, 3 – 27·10-8.