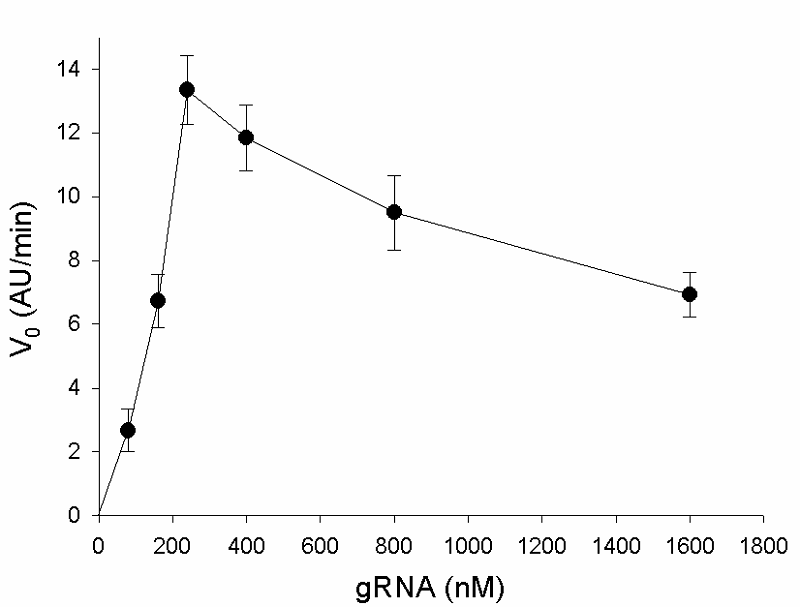
Figure 4. The dependence of the initial rate of the FQ-reporter cleavage on the gRNA concentration in a 50 µL sample. Cas13a concentration – 100 nM; the amount of tRNA in the sample – 100 ng. The mean values and corresponding standard errors for three independent measurements are shown.