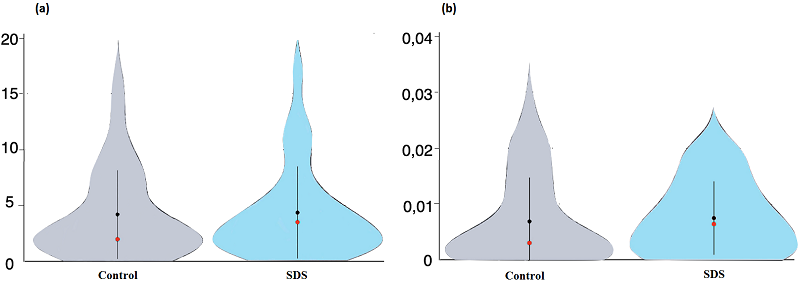

Figure 2. Violin plots of some parameters for identifying proteins encoded by human chromosome 18 genes in HaCaT cells before and after exposure to SDS. (a) Distribution of unique peptides per protein; (b) Distribution of NSAF values. Gray color - control cells, blue color – keratinocytes after exposure to SDS. The black dot indicates the mean value of the parameter, the red dot is the median, and the vertical black line is the standard deviation.