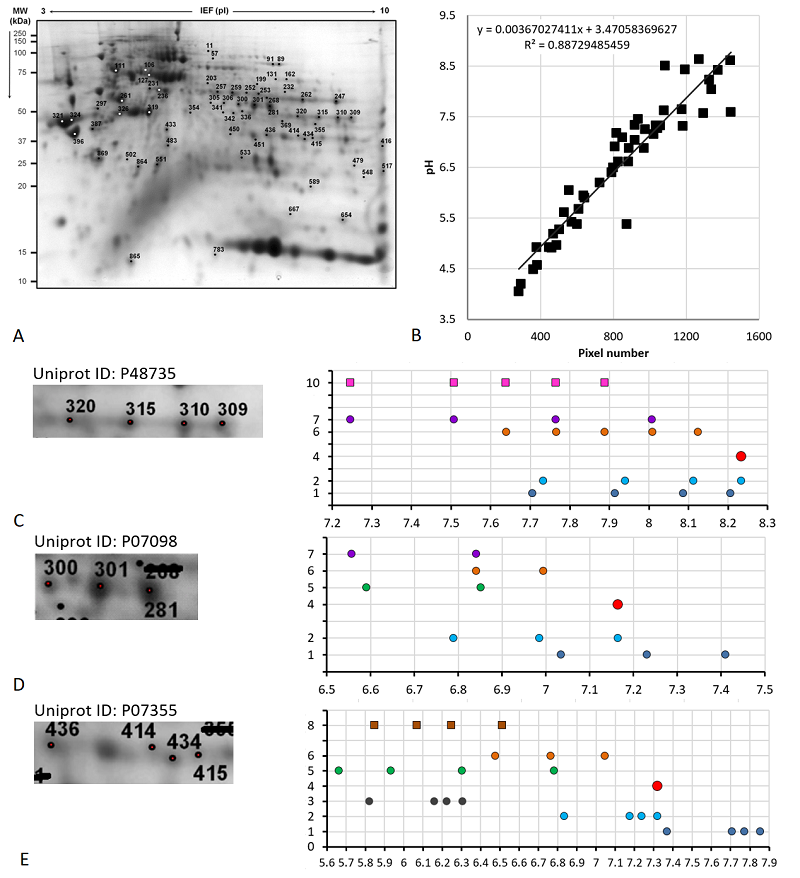

Figure 3. Results of map 2 analysis. A. Photo of the map published in the article [13]. B. Comparison of pixel coordinates (abscissa) and predicted pI values (ordinate) of identified proteins (in the presence of several proteoforms, only the most basic form was taken into account) and the correlation equation used to recalculate the pI values from the coordinates. C-E. Analysis of proteoforms of identified proteins. On the left is a fragment of a photograph of the map with analyzed proteoforms.