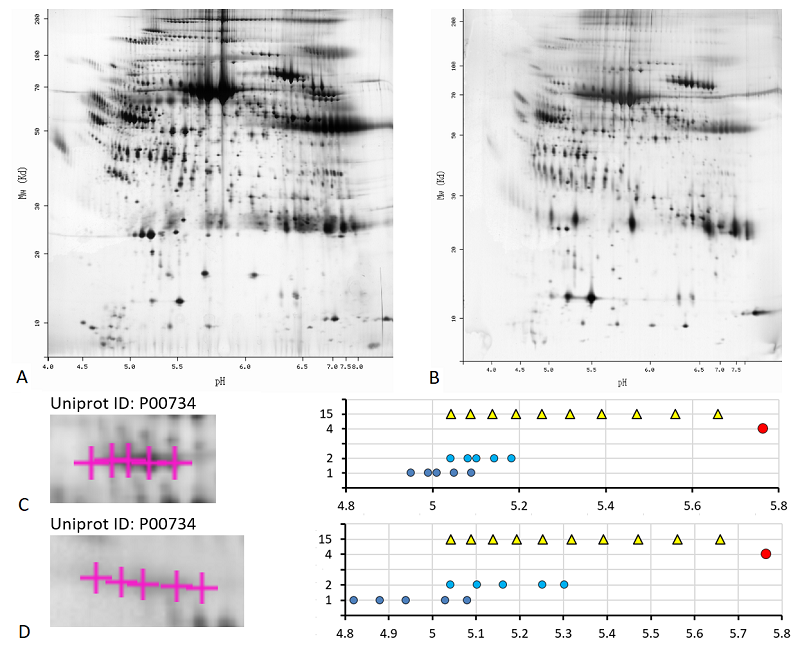

Figure 6. Results of analysis of prothrombin proteoforms on maps 5 (A, C) and 6 (B, D). To the left of the diagrams is a fragment of a photograph of the map [16, 17] with analyzed proteoforms. Row 15 - glutamate carboxylation (from 1 to 10 residues).