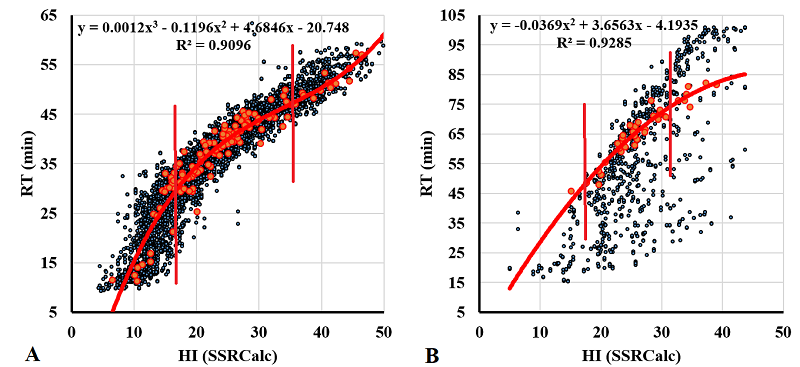

Figure 1. Examples of correlations between the observed RT values and HI values calculated by the SSRCalc program for samples S5 (A) and S22 (B). One of the fractions for which the trend line parameters are given is highlighted in red. Vertical lines limit the area of linear dependence.