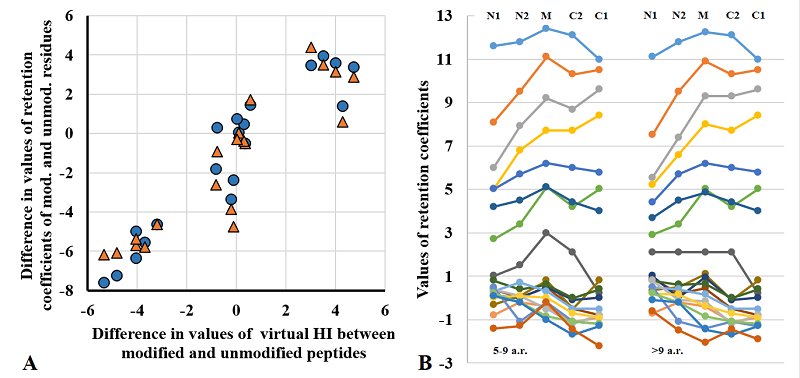

Figure 3. A. Comparison of the averaged values of the bias of the virtual HI for peptides with the same amino acid sequence after PTM addition with the value of the retention coefficient determined in this work. The values calculated for sets of peptides with a single PTM are shown in blue, and those calculated for peptides with more than one PTM are shown in orange. B. Comparison of retention factor values for 20 canonical amino acid residues set in the SSRCalc program for different positions in the peptide.