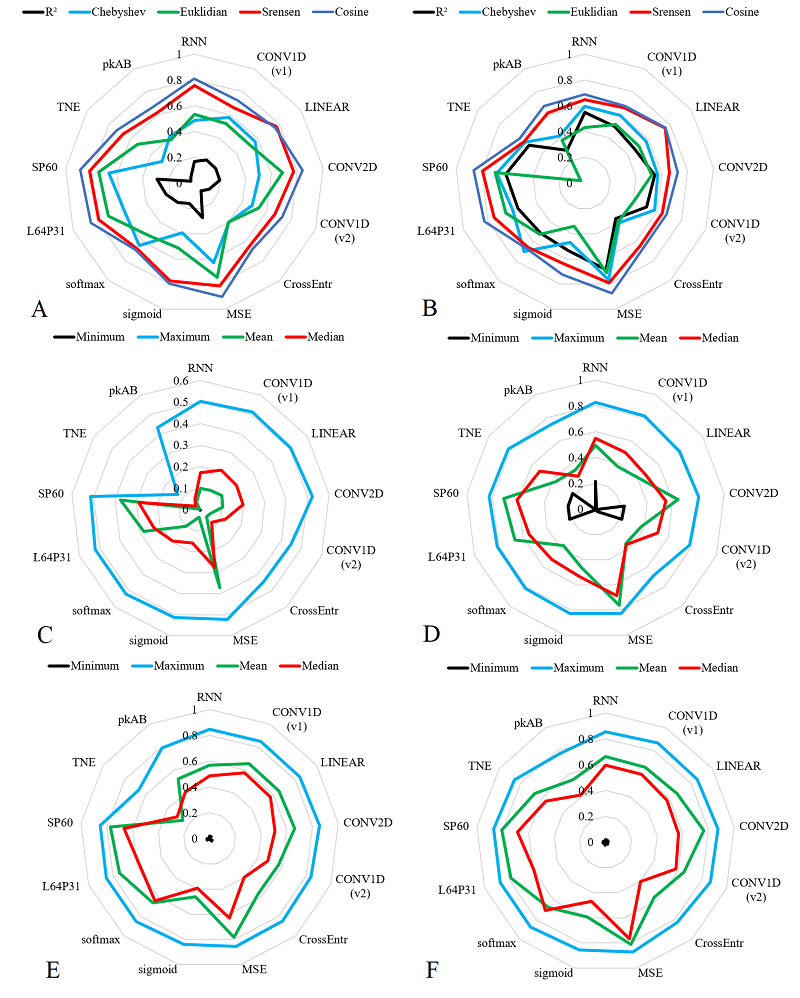
Figure 1. Distributions of maximum, minimum, mean and median values of the metrics used, grouped by individual characteristics of the constructed neural networks. A, C, E - data for 30% of the test sets. B, D, F - data for independent sets. A, B - Comparison of the metrics in terms of the value of the median. C, D- coefficient of determination. E, F- Chebyshev metric. For the Euclidean, Sørensen and Chebyshev metrics, the value "1 - value of the metric" is given.