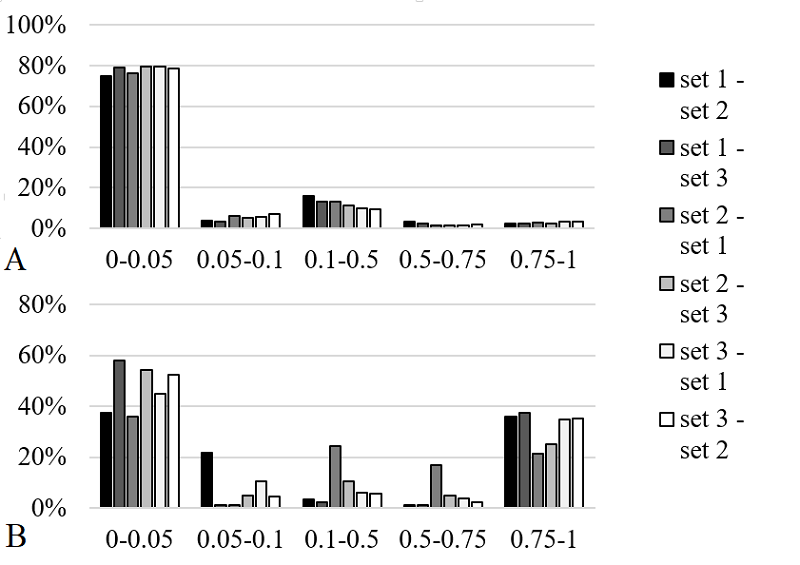
Figure 2. Histogram of the absolute value of the prediction error distribution for the neural networks selected by the best median values for the Chebyshev metric. A. SP60 input data variant. B. TNE input data variant. Legend: first is a training set, second is a test set.