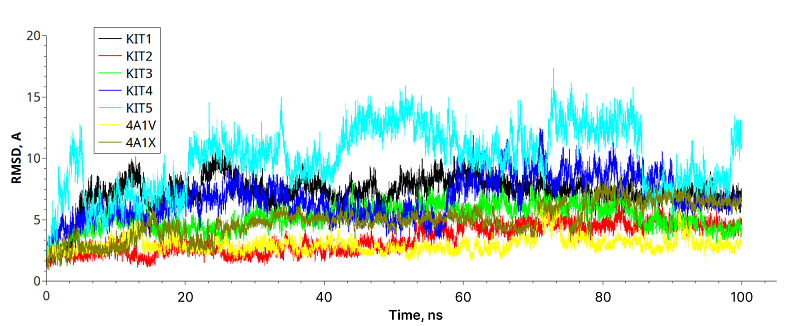
Figure 2. Root Mean Square Deviation of the modified knottins during molecular dynamics simulation of protein–knottin complexes: black (KIT-1), red (KIT-2), green (KIT-3), deep-blue (KIT-4) and turquoise (KIT-5) lines, yellow and brown - peptide NS3 inhibitors.