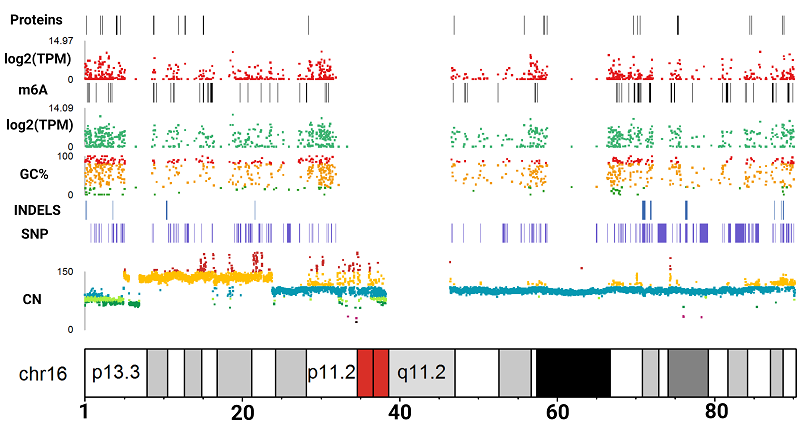
Figure 3. Molecular map for the chromosome 16. From bottom to top: chromosome coordinates, CN – gene copy number, SNP – nonsynonymous single nucleotide polymorphisms, Indels – insertions and deletions, GC% – methylation regions, log2(TPM) – gene expression, m6A sites, log2(TPM) – translatome expression, and protein occurrence. Colors at the CN level: black indicates copy number 0, pink – copy number 1, green – copy number 2, light green – copy number 2.5, blue – copy number 3, yellow – copy number 4, and red – copy number 5. Colors at the GC% level: red – genes with high methylation levels, yellow – medium methylation levels, and green – low methylation levels.