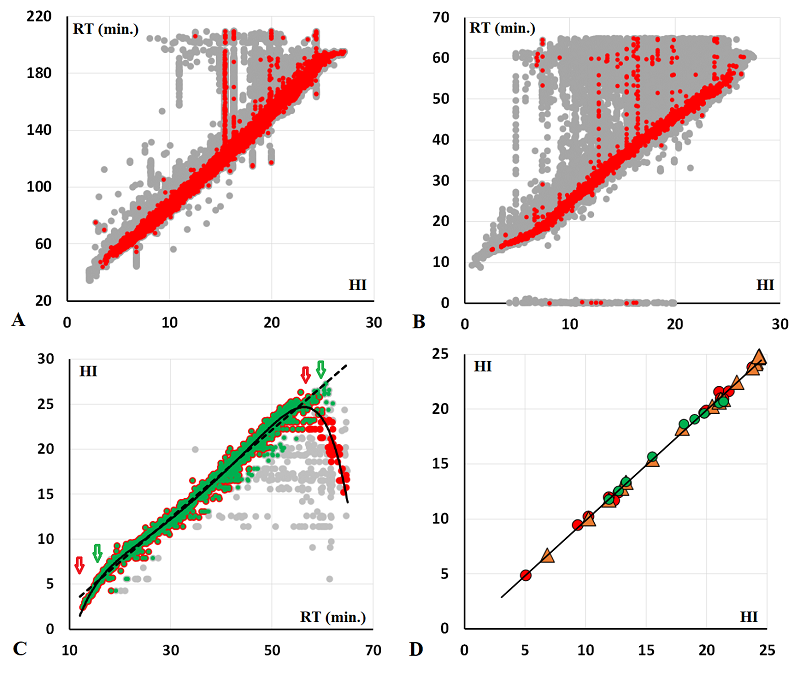
Figure 2. The examples of data comparison of correlation between RT and HI values at different stages of the alignment program. A. Raw data for set 1 (for peptides occurring in both the test and “reference” sets), gray shows data from all samples, red for one of them. B. Similarly for set 2 (data up to 2 min RT are essentially dirt and should be removed when starting). C. Example of constructing a correlation equation to recalculate RT values to HI and determine confidence interval. Green and dashed line, linear relationship; red and solid, 5th order polynomial equation; gray, excluded observations. Arrows mark the boundaries of confidence intervals. D. Example of comparison of equated HI values for 3 samples with minimal overlap of peptides with the 11th sample.