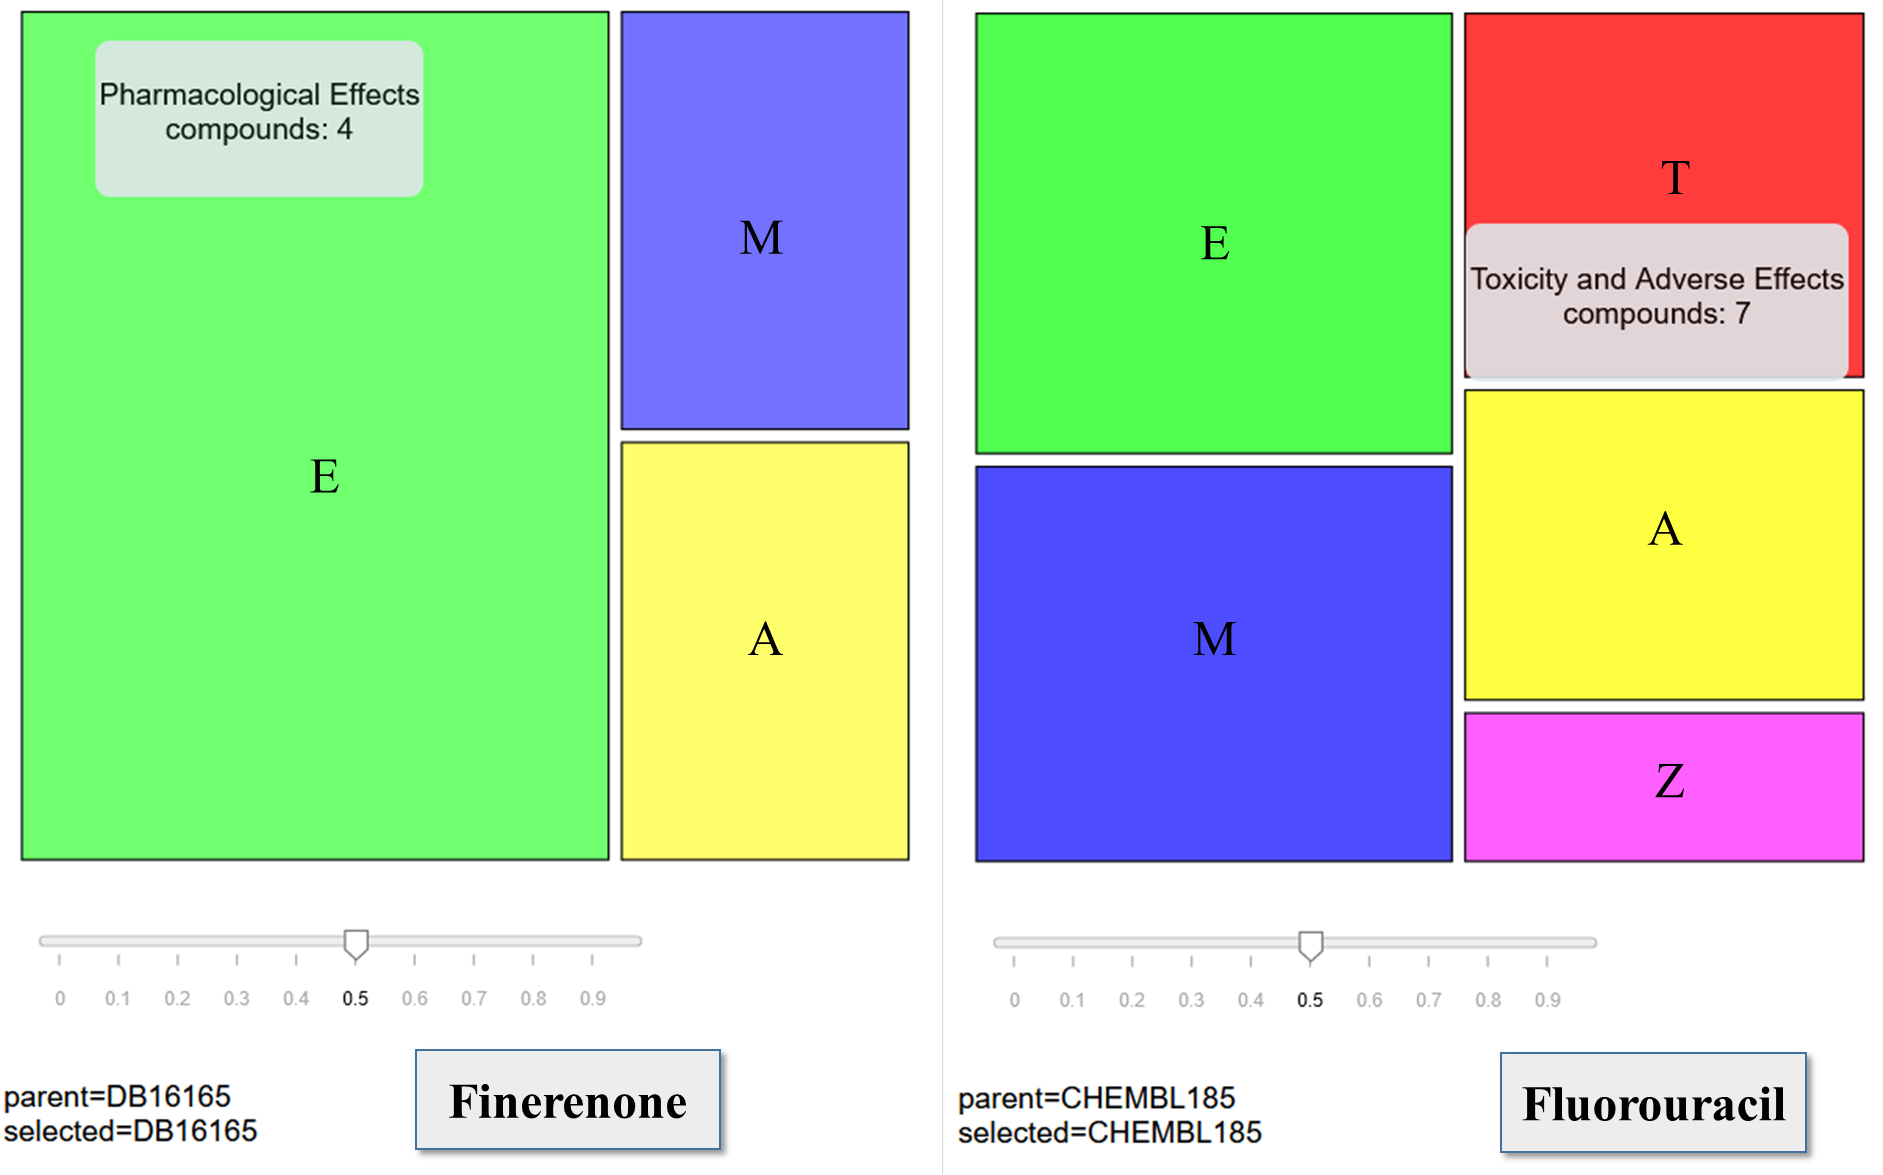
Figure 3. General view of the color map (treemap) of finerenone and fluorouracil displaying the biological activity spectrum prediction at the cutoff value of Pa – Pi >0.5, taking into account their metabolites.