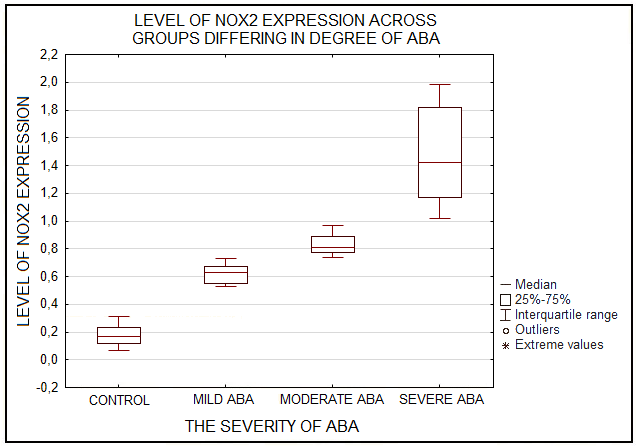
Figure 4. Diagram of NOX2 expression levels in monocytes of healthy donors (control) and patients with varying degrees of atopic bronchial asthma (ABA) determined by RT-PCR.