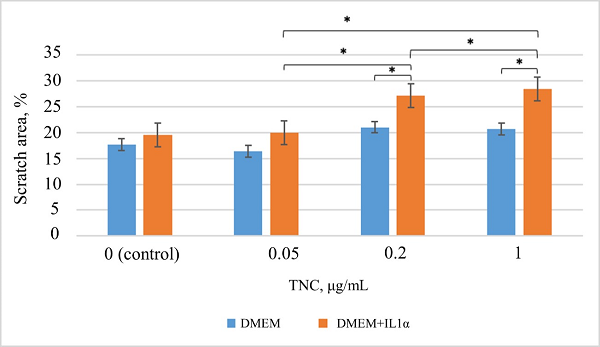
Figure 2. Results of the analysis of migratory activity under TNC exposure according to the scratch assay. * – the differences are statistically significant, p < 0.05.