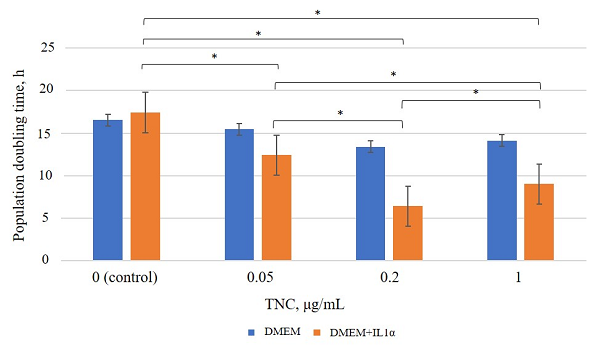
Figure 3. Population doubling time under TNC exposure. * – the differences are statistically significant, p < 0.05.