Molecular profile of the HepG2 tumor cell line
Institute of Biomedical Chemistry, 10 Pogodinskaya str., Moscow, 119121 Russia; *e-mail: arzumanian.victoria@gmail.com
Keywords: HepG2; cell line; omics data; gene regulation; molecular portrait
DOI:10.18097/BMCRM00239
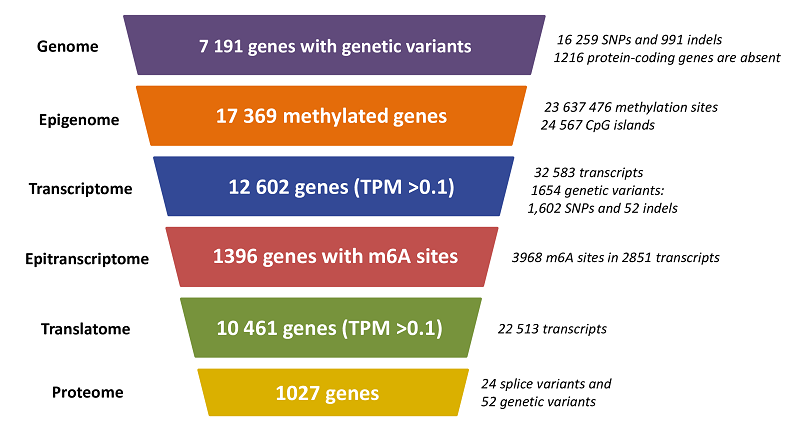
Cell lines are widely used in scientific research due to their accessibility, stability, and functional similarity to the original cells. The HepG2 line, being the fourth most popular cell culture, is often used in toxicological and metabolic studies due to its partial retention of hepatocyte properties.In our study, the molecular portrait of the HepG2 cell culture was constructed for the first time. To build this portrait, we used previously obtained data for a single sample, including results of whole-genome sequencing (WGS), whole-genome bisulfite sequencing (WGBS), transcriptome (RNA-seq), translatome (Polysome-seq), and proteome (LC-MS/MS) profiling. For the assessment of HepG2 cell line heterogeneity, we analyzed whole-genome and transcriptome data published in the NCBI SRA database, as well as proteome research results available in the PRIDE resource.Our study showed that the HepG2 cell line generally demonstrates a high degree of stability at the genomic and transcriptomic levels; however, samples from China require closer attention when transferring the results of transcriptomic and proteomic experiments. The HepG2 genotype is characterized by stable chromosomal rearrangements, such as translocation between the short arms of chromosomes 1p and 21p, tetrasomy of chromosome 20, loss of the short arm of all SAT chromosomes, and the long arm of the Y chromosome. Despite the absence of 1216 protein-coding genes at the genomic level, 12,602 genes are expressed at the transcriptomic level, of which only 10,461 are detected at the translatome level, and only 1027 genes are identified at the proteome level, which is related to the limitations of mass spectrometry sensitivity. As a result of the omics data analysis, we presented a detailed molecular portrait of the HepG2 cell culture, illustrating the omics profile at various levels for each gene.
|
Figure 1.
The detectable molecular profile of the HepG2 cell line sample.
|
|
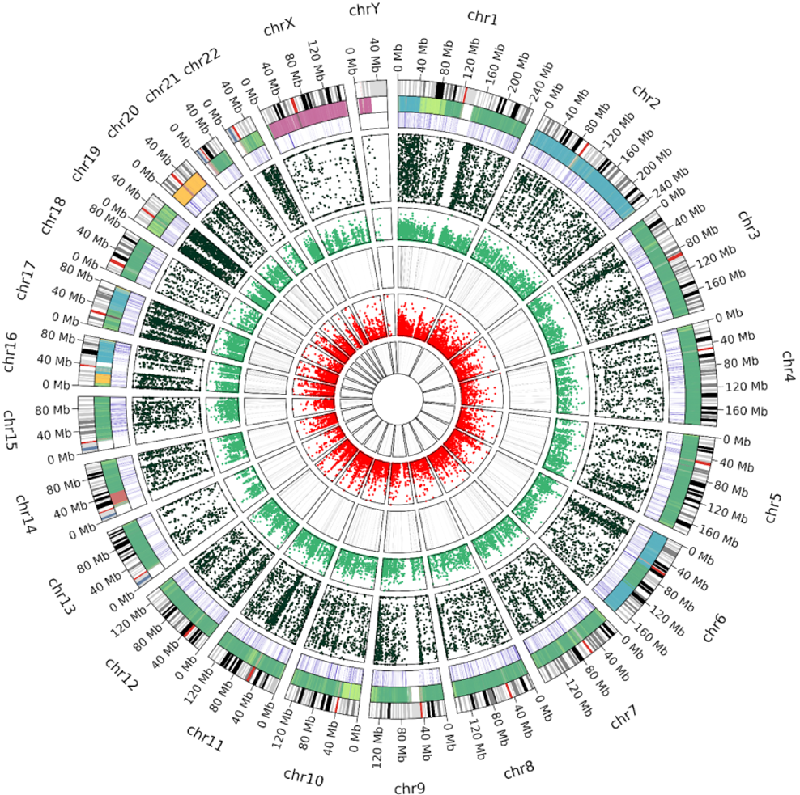
Figure 2.
Molecular map for the HepG2 cell line. From the outermost circle: chromosome coordinates, gene copy number, genetic variants, methylation regions, gene expression, m6A sites, translatome expression, and protein occurrence.
|
|
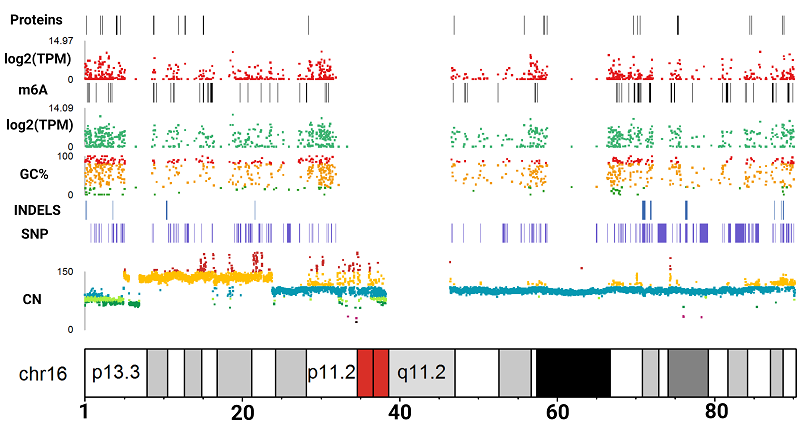
Figure 3.
Molecular map for the chromosome 16. From bottom to top: chromosome coordinates,
CN – gene copy number, SNP – nonsynonymous single nucleotide polymorphisms, Indels – insertions and deletions, GC% – methylation regions, log2(TPM) – gene expression, m6A sites, log2(TPM) – translatome expression, and protein occurrence. Colors at the CN level: black indicates copy number 0, pink – copy number 1, green – copy number 2, light green – copy number 2.5, blue – copy number 3, yellow – copy number 4, and red – copy number 5. Colors at the GC% level: red – genes with high methylation levels, yellow – medium methylation levels, and green – low methylation levels. |
FUNDING
The work was performed within the framework of the Program for Basic Research in the Russian Federation for a long-term period (2021-2030) (no. 122030100168-2).
REFERENCES
- Yu, Y., Zhang, N., Mai, Y., Ren, L., Chen, Q., Cao, Z., Chen, Q., Liu, Y., Hou, W., Yang, J., Hong, H., Xu, J., Tong, W., Dong, L., Shi, L., Fang, X., Zheng, Y. (2023) Correcting batch effects in large-scale multiomics studies using a reference-material-based ratio method. Genome Biol., 24(1), 201. DOI
- Goodspeed, A., Heiser, L.M., Gray, J.W., Costello, J.C. (2016) Tumor-derived cell lines as molecular models of cancer pharmacogenomics. Mol. Cancer Res., 14(1), 3–13. DOI
- Gillet, J.-P., Varma, S., Gottesman, M.M. (2013) The clinical relevance of cancer cell lines. Journal of the Natl. Cancer Inst., 105(7), 452–458. DOI
- Liu, Y., Mi, Y., Mueller, T., Kreibich, S., Williams, E.G., van Drogen, A., Borel, C., Frank, M., Germain, P.-L., Bludau, I., Mehnert, M., Seifert, M., Emmenlauer, M., Sorg, I., Bezrukov, F., Bena, F.S., Zhou, H., Dehio, C., Testa, G., Saez-Rodriguez J., Antonarakis S.E., Hardt W.D., Aebersold R. (2019) Multi-omic measurements of heterogeneity in HeLa cells across laboratories. Nat. Biotechnol., 37(3), 314–322. DOI
- Poverennaya, E.V., Pyatnitskiy, M.A., Dolgalev, G.V., Arzumanian, V.A., Kiseleva, O.I., Kurbatov, I.Y., Kurbatov, L.K., Vakhrushev, I.V., Romashin, D.D., Kim, Y.S., Ponomarenko, E.A. (2023) Exploiting multi-omics profiling and systems biology to investigate functions of TOMM34. Biology, 12(2), 198. DOI
- Mendeley Data. Exploiting multi-omics profiling and systems biology to investigate functions of TOMM34. Retrieved December 6, 2022, from: https://data.mendeley.com/datasets/yrmd8ygncn/1.
- Deutsch, E.W., Lane, L., Overall, C.M., Bandeira, N., Baker, M.S., Pineau, C., Moritz, R.L., Corrales, F., Orchard, S., van Eyk, J.E., Paik, Y.-K., Weintraub, S.T., Vandenbrouck, Y., Omenn, G.S. (2019) Human proteome project mass spectrometry data interpretation guidelines 3.0. J. Proteome Res., 18(12), 4108–4116. DOI
- Zhou, B., Ho, S.S., Greer, S.U., Spies, N., Bell, J.M., Zhang, X., Zhu, X., Arthur, J.G., Byeon, S., Pattni, R., Saha, I., Huang, Y., Song, G., Perrin, D., Wong, W.H., Ji, H.P., Abyzov, A., Urban, A.E. (2019) Haplotype-resolved and integrated genome analysis of the cancer cell line HepG2. Nucleic Acids Res., 47(8), 3846–3861. DOI
- Wong, N., Lai, P., Pang, E., Leung, T.W., Lau, J.W., Johnson, P.J. (2000) A comprehensive karyotypic study on human hepatocellular carcinoma by spectral karyotyping. Hepatology (Baltimore, Md), 32(5), 1060–1068. DOI
- Simon, D., Aden, D.P., Knowles, B.B. (1982) Chromosomes of human hepatoma cell lines. Int. J. Cancer, 30(1), 27–33. DOI
- Chen, H.L., Chiu, T.S., Chen, P.J., Chen, D.S. (1993) Cytogenetic studies on human liver cancer cell lines. Cancer Genet. Cytogen., 65(2), 161–166. DOI
- Guo, J.-J., Ye, Y.-Q., Liu, Y.-D., Wu, W.-F., Mei, Q.-Q., Zhang, X.-Y., Lao, J., Wang, B., Wang, J.-Y. (2022) Interaction between human leukocyte antigen (HLA-C) and killer cell Ig-like receptors (KIR2DL) inhibits the cytotoxicity of natural killer cells in patients with hepatoblastoma. Front. Med., 9, 947729. DOI
- Strichman-Almashanu, L.Z., Lee, R.S., Onyango, P.O., Perlman, E., Flam, F., Frieman, M.B., Feinberg, A.P. (2002) A genome-wide screen for normally methylated human CpG islands that can identify novel imprinted genes. Genome Res., 12(4), 543–554. DOI
- Arzumanian, V.A., Kiseleva, O.I., Poverennaya, E.V. (2021) The curious case of the HepG2 cell line: 40 years of expertise. Int. J. Mol. Sci., 22(23), 13135. DOI
- Arzumanian, V.A., Kurbatov, I.Y., Ptitsyn, K.G., Khmeleva, S.A., Kurbatov, L.K., Radko, S.P., Poverennaya, E.V. (2023) Identifying N6-methyladenosine sites in HepG2 cell lines using oxford nanopore technology. Int. J. Mol. Sci., 24(22), 16477. DOI