Alignment and Normalization of Mass Spectrometry Data Using the Hydrophobicity Index
Institute of Biomedical Chemistry, 10 Pogodinskaya str., Moscow, 119121 Russia; *e-mail: an.voronina@list.ru
Keywords: retention time; mass spectrometry; data alignment
DOI:10.18097/BMCRM00245
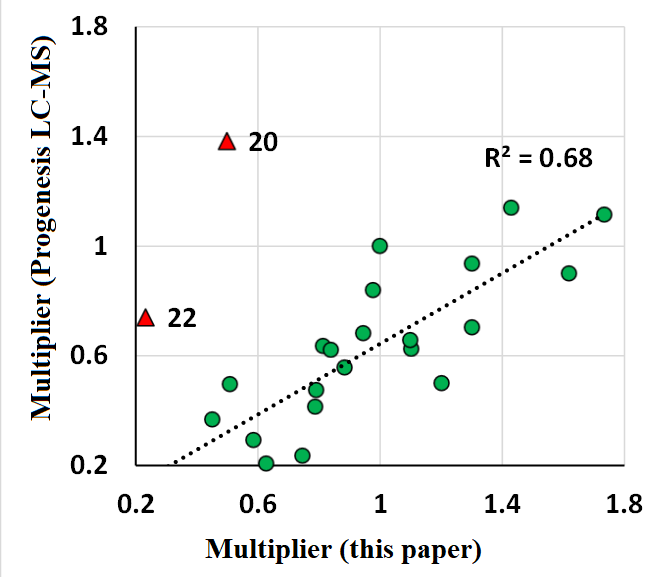
This paper presents a program for the alignment of data from mass spectrometry experiments by retention time on a chromatographic column. The program uses the experimentally obtained data set as a reference against which the alignment procedure is performed. The primary advantage of this approach consists in its capacity to align data sets that had significant variations in both peptide composition and substance amount, such as individual fractions derived from multivariate separation. To illustrate this, two datasets were employed. The first dataset contains data obtained after multivariate separation, while the second dataset exhibited comparable peptide composition across all samples. The second dataset was used to assess the efficacy of the alignment program in normalizing signal intensity between individual samples. The results were compared with the normalization results obtained by the Progenesis LC-MS program. The normalization multipliers obtained for 22 of the 24 samples exhibited good correlation with those calculated by the Progenesis LC-MS (R2 = 0.68). The program is freely available at http://lpcit.ibmc.msk.ru/AlignRT.
|
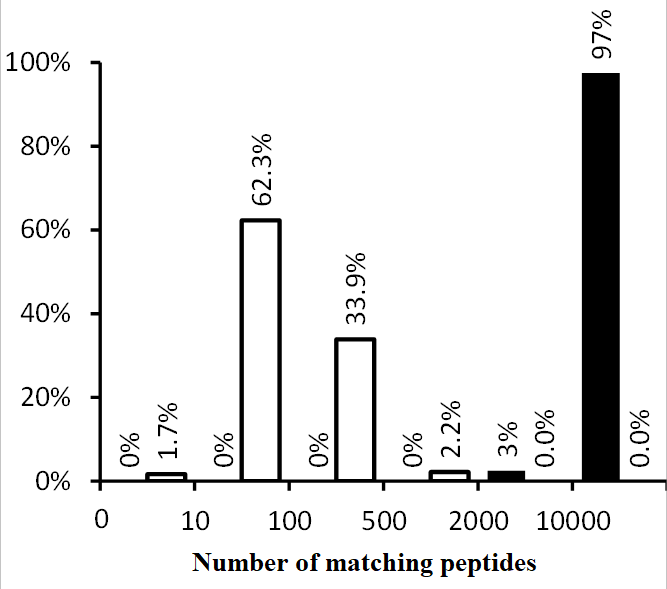
Figure 1.
The distribution of the number of matching peptides in pairwise comparisons of samples from sets 1 (black) and 2 (white).
|
|
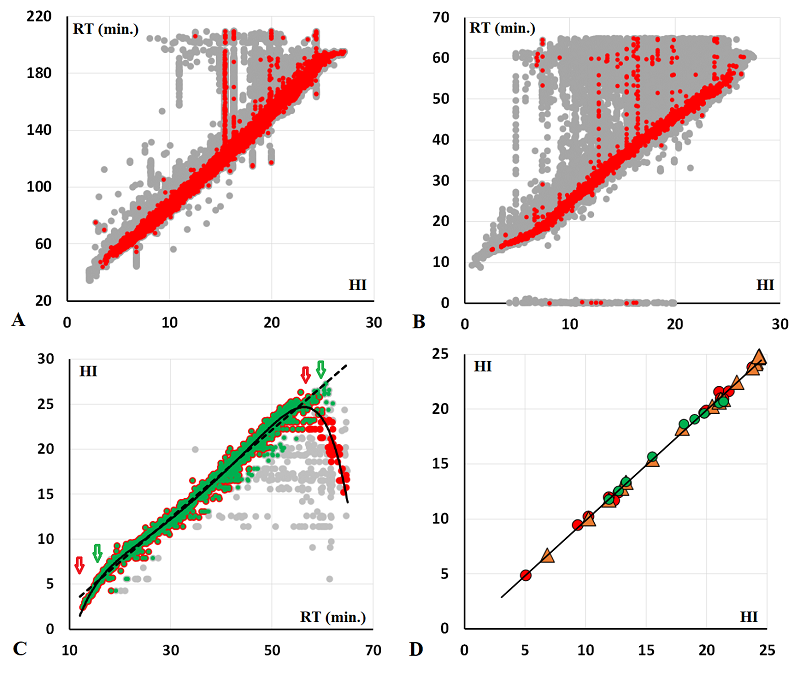
Figure 2.
The examples of data comparison of correlation between RT and HI values at different stages of the alignment program.
A. Raw data for set 1 (for peptides occurring in both the test and “reference” sets), gray shows data from all samples, red for one of them. B. Similarly for set 2 (data up to 2 min RT are essentially dirt and should be removed when starting). C. Example of constructing a correlation equation to recalculate RT values to HI and determine confidence interval. Green and dashed line, linear relationship; red and solid, 5th order polynomial equation; gray, excluded observations. Arrows mark the boundaries of confidence intervals. D. Example of comparison of equated HI values for 3 samples with minimal overlap of peptides with the 11th sample. |

|
Figure 3.
Data correction for the abundance value of data set 1.
A. Five peptides each (data from each normalized relative to its mean (1) across all samples) representing 2 different clusters (taken from the central part); red lines are the biggest cluster; blue lines are the cluster maximally different from the first. B. Red line is the mean value (2) within a single sample for all ions of the biggest cluster; gray lines show the fluctuating data for each sample. C. Data from Figure A normalized to the mean value (2). On the ordinate axis is the normalized abundance value for each peptide ion. Sample numbers are plotted on the abscissa axis: 1-8 left hemisphere of experimental mice unaffected by stroke; 9-16 right hemisphere of experimental mice in which stroke was induced; 17-20 left hemisphere of control mice, 21-24 right hemisphere of control mice. |
|
Figure 4.
The comparison of multipliers for normalization of abundance calculated in this paper with data obtained in [17]. Samples 20 and 22, falling out of the general trend, are marked in red.
|
|
CLOSE
|
Table 1.
The number of peptides obtained by virtual cleavage by trypsin that could theoretically match the “reference” set for different biological species.
|
FUNDING
The work was performed within the framework of the Program for Basic Research in the Russian Federation for a long-term period (2021-2030) (№ 122030100170-5).
REFERENCES
- Lange, E., Tautenhahn, R., Neumann, S., Gröpl, C. (2008) Critical assessment of alignment procedures for LC-MS proteomics and metabolomics measurements. BMC Bioinformatics, 9, 375. DOI
- Ong, S.E., Mann, M. (2005) Mass spectrometry-based proteomics turns quantitative. Nature Chemical Biology, 1(5), 252-262. DOI
- Ong, S.E., Foster, L.J., Mann, M. (2003) Mass spectrometric-based approaches in quantitative proteomics. Methods (San Diego, Calif.), 29(2), 124-130. DOI
- Vandenbogaert, M., Li-Thiao-Té, S., Kaltenbach, H.M., Zhang, R., Aittokallio, T., Schwikowski, B. (2008) Alignment of LC-MS images, with applications to biomarker discovery and protein identification. Proteomics, 8(4), 650-672. DOI
- America, A.H., Cordewener, J.H. (2008) Comparative LC-MS: a landscape of peaks and valleys. Proteomics, 8(4), 731-749. DOI
- Fischer, B., Grossmann, J., Roth, V., Gruissem, W., Baginsky, S., Buhmann, J.M. (2006) Semi-supervised LC/MS alignment for differential proteomics. Bioinformatics, 22(14), e132-140. DOI
- Jaffe, J.D., Mani, D.R., Leptos, K.C., Church, G.M., Gillette, M.A., Carr, S.A. (2006) PEPPeR, a platform for experimental proteomic pattern recognition. Molecular & Cellular Proteomics, 5(10), 1927-1941. DOI
- Prince, J.T., Marcotte, E.M. (2006) Chromatographic alignment of ESI-LC-MS proteomics data sets by ordered bijective interpolated warping. Analytical Chemistry, 78(17), 6140-6152. DOI
- Ramiro, L., Faura, J., Simats, A., García-Rodríguez, P., Ma, F., Martín, L., Canals, F., Rosell, A., Montaner, J. (2023) Influence of sex, age and diabetes on brain transcriptome and proteome modifications following cerebral ischemia. BMC Neuroscience, 24(1), 7. DOI
- ProteomeXchange, project PXD051750. Retrieved January 29, 2025, from: http://central.proteomexchange.org/cgi/GetDataset?ID=PXD051750 DOI
- Branca, R., Orre, L., Johansson, H., Granholm, V., Huss, M., Pérez-Bercoff, A., Forshed, J., Käll, L., Lehtiö, J. (2014) HiRIEF LC-MS enables deep proteome coverage and unbiased proteogenomics. Nature Methods, 11, 59-62. DOI
- Xin, L., Qiao, R., Chen, X., Tran, H., Pan, S., Rabinoviz, S., Bian, H., He, X., Morse, B., Shan, B., Li, M. (2022) A streamlined platform for analyzing tera-scale DDA and DIA mass spectrometry data enables highly sensitive immunopeptidomics. Nature Communications, 13, 3108. DOI
- Wilburn, D.B., Shannon, A.E., Spicer, V., Richards, A.L., Yeung, D., Swaney, D.L., Krokhin, O.V., Searle, B.C. (2023) Deep learning from harmonized peptide libraries enables retention time prediction of diverse post translational modifications, bioRxiv, 5(30), 542978. DOI
- Wilhelm, M., Zolg, D.P., Graber, M., Gessulat, S., Schmidt, T., Schnatbaum, K., Schwencke-Westphal, C., Seifert, P., de Andrade Krätzig, N., Zerweck, J., Knaute, T., Bräunlein, E., Samaras, P., Lautenbacher, L., Klaeger, S., Wenschuh, H., Rad, R., Delanghe, B., Huhmer, A., Carr, S.A., Clauser, K.R., Krackhardt, A.M., Reimer, U., Kuster, B. (2021) Deep learning boosts sensitivity of mass spectrometry-based immunopeptidomics. Nature Communications, 12, 3346. DOI
- Gessulat, S., Schmidt, T., Zolg, D.P., Samaras, P., Schnatbaum, K., Zerweck, J., Knaute, T., Rechenberger, J., Delanghe, B., Huhmer, A., Reimer, U., Ehrlich, H.C., Aiche, S., Kuster, B., Wilhelm, M. (2019) Prosit: proteome-wide prediction of peptide tandem mass spectra by deep learning. Nature Methods, 16(6), 509-518. DOI
- Voronina, A.I., Rybina, A.V. (2023) A Program for Predicting the Retention Time of Peptides with Post-Translational Modifications. Biomedical Chemistry: Research and Methods, 6(3), e00196. DOI
- Rybina, A.V. (2024) Identification of mouse brain proteoforms: comparison of 2D-electrophoresis data and independent experiment with mass spectrometric identification. Biomeditsinskaya Khimiya, 70(6), 475-480. DOI
- Progenesis LC-MS version 4.0, Nonlinear Dynamics, Newcastle upon Tyne, UK.